Centralized PHP Logging Patterns
We’ve all been there, something goes wrong in our application and we start the tedious task of ‘grep'ing through thousands of lines of logs to find out what’s going on. Once you have a couple of servers or containers this becomes an almost impossible task and the classic SSH and tail won’t serve you well anymore. In this talk Philipp Krenn, developer at Elastic, talked about some logging patterns using the Elastic Stack.

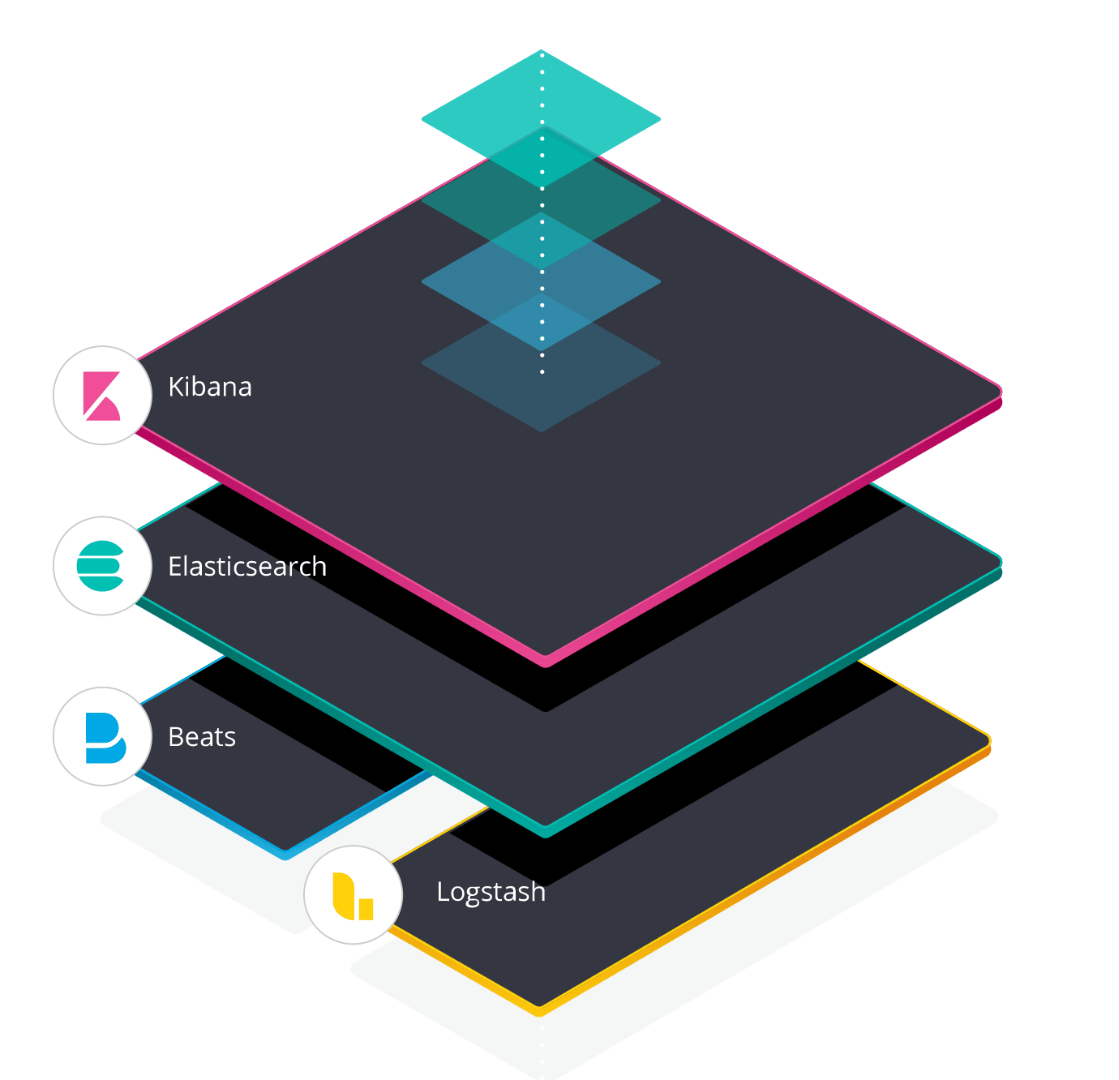
So what is this Elastic Stack you might ask? The Elastic Stack mainly consists of four services. Obviously got Elastic Search, which will serve as a database for all of our logs. Kibana will handle the presentation layer, here we can make a neat representation of our logs and create some more user-friendly interfaces. Beats will forward our logs and serve them to our database. Finally, logstash is used to parse and enrich the data we want to send to our Elastic Search.
Krenn proposed five ways to centralize your logs in your Elastic Stack, companies should pick the ones that fit their needs best. I'll go over them briefly but make sure to check out code examples on his github.
- Parsing: Utilizing the grok debugger in Kibana, you can parse the relevant pieces of information out of your logfile to something readable and filterable by using regular expressions. Over time you’ll have a good sample size of reusable expressions to quickly get the data you need over multiple projects. Alternatively, elastic also offers the data visualizer which can detect possible fields and make your job easier.
Disadvantages: Regex is tedious. What about multiline logs? Wat about different log formats? - Send: Of course you can also use an appender, like GelfHandler or ElasticSearchHandler, to send your events directly to elastic without first persisting them to a log file.
Disadvantages: This is very tightly coupled. You wont have any logs during outages. - Structured: You could write your events in a structured format like JSON and centralize them afterwards, you won’t even need logstash to parse the files for you. The elastic community offers the Elastic Common Schema to help you normalize your JSON files. The ECS specifies a common set of fields when storing event data in Elasticsearch.
Disadvantages: Again, this is very tightly coupled. Serialization is very slow and will cause you some overhead. - Containerize: Enter Docker containers. Everybody is using Docker containers these days, right? Of course you can log everything in your Docker logs and send this to Elastic. You can easily enrich your logs by adding metadata from Docker itself. This is probably the way to go for most companies. Through the Docker socket you can gather all log files from running containers and process them.
Disadvantages: A little bit more complex to set up and get right. - Orchestrate: Kubernetes is the next step up from running non-orchestrated Docker containers. Setting up a daemonset of Fluentd containers allows it to gather all logs from all nodes automatically. Kubernetes makes sure when scaling the number of nodes in the cluster all logging remains consistent. Because of easy scalability Kubernetes is the ideal choice to host your ELK Stack because it can easily adapt to the variable amount of logs you want to process.
Disadvantages: Expert level setup
Conclusion
You don't have to go all out and turn your whole infrastructure on it's head just to have a nice logging pattern. Pick the structure that works best for your organisation and work towards better solutions when it's fit to do so. This talk just gave you some nice examples and hopefully some inspiration to have a professional logging infrastructure in your company.
